HubPages

Sunday 30 October 2011

Using excel to analyze Zulutrade signal providers

Zulutrade is an automated forex system which allows users to open an account and automatically copy successful traders for free.  It sounds too good to be true right? Well it is and it isn’t. Zulutrade has the potential to make very good returns if the right traders (signal providers) are selected to copy, but it isn’t as easy as it sounds. Just blindly selecting profitable signal providers to copy will lead to trouble without first analyzing the risk and setting stop losses manually to limit the losses that can be incurred by the signal providers. This article outlines how to go about doing this by using excel to analyze the trade history of zulutrade signal providers.

The signal provider information on Zulutrade is good but it only tells half the story. One of the good and bad aspects of Zulutrade is that anybody can become a signal provider. There are numerous instances of signal providers which show an impressive upward trending profit line and on first glance appear very attractive systems to follow. However it is not until you get into the detail that it becomes clear that these systems are workable only with unlimited capital demo accounts where large open losses can be rode out and sustained. In reality the systems would blow up very quickly  as open losses and positions lead to a margin call.

If Zulutrade is going to work over the medium to long term it is imperative to use stop losses and calculate the optimum stop loss for each provider. This will vary depending upon each individuals risk appetite. For myself I do not want to be using signal providers who are not profitable with stops at 100 pips or less. The maximum stop loss I will set is 200 pips, ideally stops should be set under 100 pips. This is my preference only, some people will be comfortable and potentially far more profitable using much higher stops. So with these basic principles in mind  I have developed an excel spreadsheet to calculate profit for signal providers using stops from 10 pips to 200 pips.

The first step is go to click on the performance tab in Zulutrade and select the signal provider who we will analyze in excel. Lets take the signal provider Forex Cruise Control. There are several  good points that immediately stand out for Forex Cruise Control:
  • An even 35 degree upward profitability curve with no major spikes down or upward, this indicates that the signal provider has a consistent trading strategy and probably operates with their own stop losses in place.
  • Win % is 74% which is a good number. Beware of signal providers that show winning a % of 90-100%, if a signal provider has a 100% win percentage it is clear that they aren't using stops and will let losses ride until their losing positions turn around. These signal providers are unsustainable and while the results to date might appear very impressive it is inevitable that at some point the accounts will blow up as losses on open positions cause a margin call. On a demo account with near unlimited funds it is possible to maintain a 100% win ratio over a period of time, on a live account with limited funds it is not possible.
  • Maximum drawdown 21% is a little on the high side but acceptable.
  • Maximum open trades 7. This is good it shows the provider is not recklessly opening positions in order to gain commission. Beware of signal providers with max open trades of 20+,  the more open positions at one time the higher the chance of a margin call if the trades turn against the provider.
  • Other important considerations are the length of time the signal provider has been trading (in weeks) an


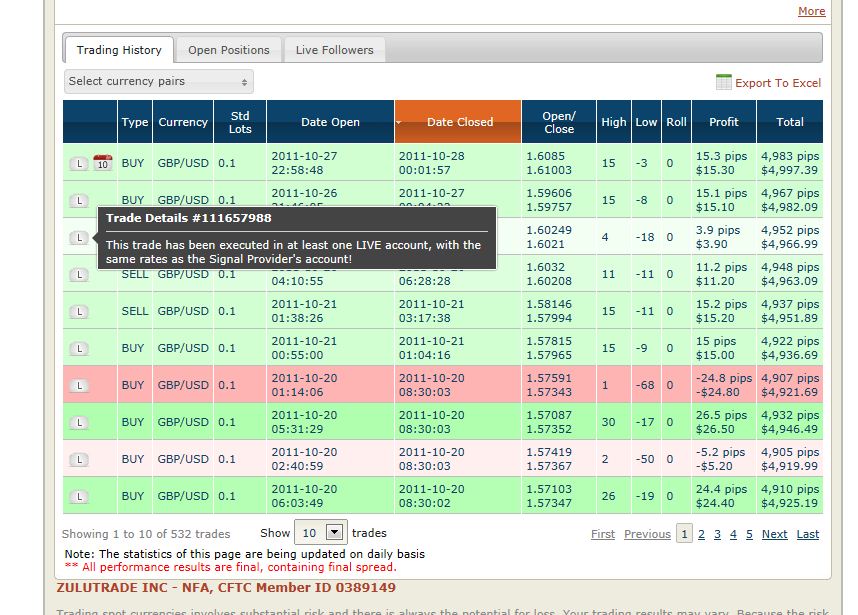
Okay so now that we have identified Forex Cruise Control as a prospective signal provider to follow we want to dig a little further and test how the profits are affected by applying a stop loss, we also want to know what the optimum stop loss we should use for this provider. To start looking at this information we click on the signal provider and scroll down to the trading history detail.

Then click on the export to excel link and export the file as a comma-separated values file (CSV File), this file contains all of the trading history for the signal provider to date.


Once the file has been saved open it up in excel and click on the data menu, import data from text file

Then click on the Forex Cruise Control csv file and import as a delimited file, click next.


We then want to click on the comma delimiter checkbox and click next.


Click through the next screen and click finish.


We then have an excel worksheet with the trade history data for Forex Cruise Control


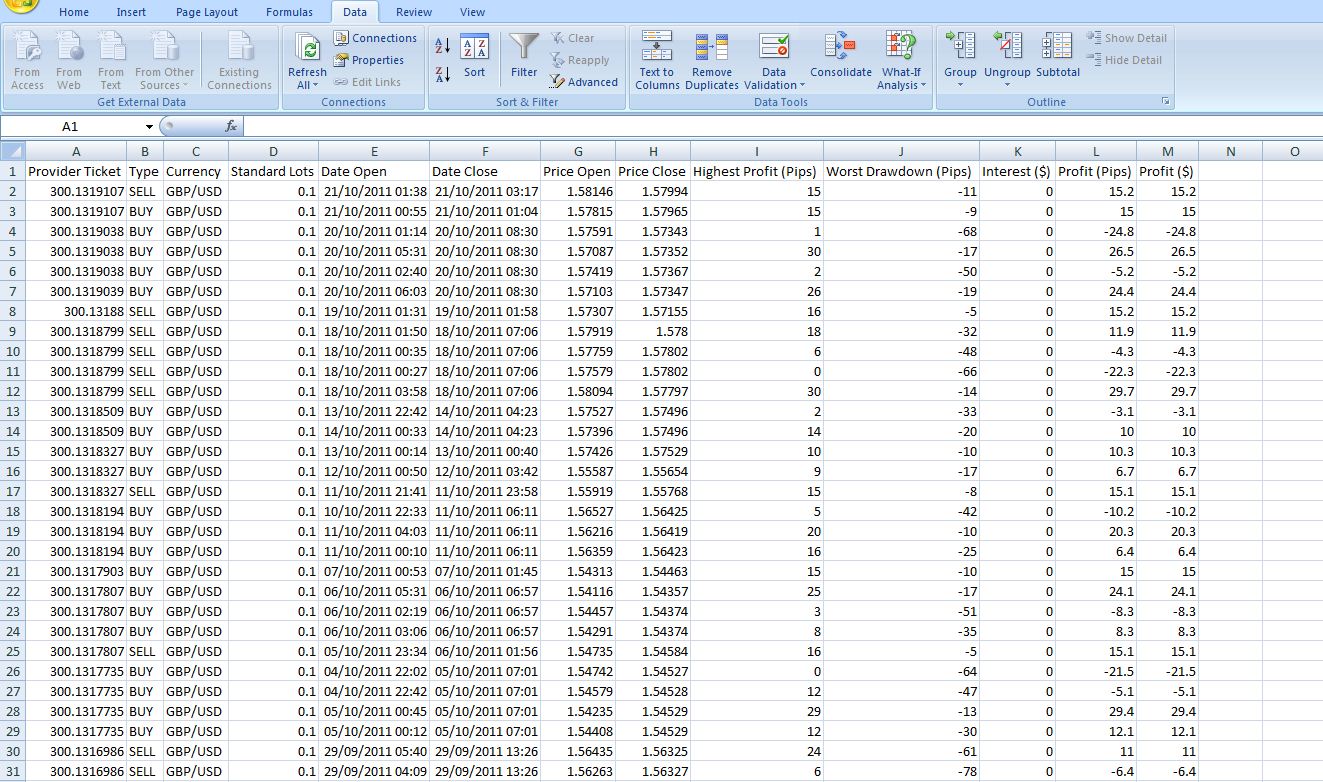
What we now want to do is to create an 'if function' to factor in the use of stop losses to this raw trading data. There are many ways of doing this, I find the following way the easiest.

Create additional columns to the right of the trade data for the stop loss limits. I have used a range from 10 pips to 200 pips but you can make this whatever you like.


We then want to use an if function to calculate what the profit (in pips) would be if the signal provider used a stop loss. Cell N2 shows the function I have used, essentially it states if (worst drawdown column J) is less than the stop loss limit (cell N1 10 pips) then cell = worst drawdown. If the reverse is true and worse drawdown is greater than the stop loss then formula = profit (pips) column L.


Once you have successfully applied that formula copy the formula across all of the columns and down the rows for all of the trade data. When we have done that sum all of the columns which will then show the profit for each of the respective stops between 10 and 200 pips.

In this case we can see that Forex Cruise Control is profitable from just 30 pips. The optimum stop loss is 190 pips which returns a profit of 3961 pips, however a lower stop could be more suitable for traders with a lower risk appetite. For example a stop of 150 pips generates nearly the same profit as a stop of 190 pips for lower risk.


Once we have used this information in excel it is straightforward to carry out additional useful analysis such as pips per trade, pips per week and most recent trading results.


By analyzing the data of signal providers in excel we get a clearer picture of how profitable the signal provider will be in the future by applying our own stop losses. I steer clear of those providers who are not profitable from stops of 100 pips or below as the risk is too high for my own preferences and I don't want to be carrying open trades with high losses.

In conclusion using excel to analyze signal providers trading data provides a clearer understanding of the risk involved with the signal provider and how profitable the provider will be when applying stops. It is interesting that many providers with high rankings do not perform well when applying tight stops to their trading data.

Disclaimer: I am not a forex expert and this opinion is mine only, please conduct your own due diligence before trading with zulutrade or using any of the signal providers mentioned in this article.

Saturday 29 October 2011

Zulutrade live results - week ended 29 October 2011

Profit for the week £23.5 (382 pips)
Loss since the start £204 (1561 pips)

Overall it was a reasonable week, I finished the week with a realised profit of £23.5. The below image shows the profit by signal providers for the week. The best performing signal providers (excluding manual trades) were Climber SB and Timo. I added the signal provider SAKOFX late in the week and removed the signal provider Forextechnotrader_LT.

I am more confident in the signal providers in my portfolio than I was when I first started out. The one issue I now have is the dominance of the EUR/USD pairing, which accounts for approximately 80% of my trades.  I have spent the past few days looking for signal providers who specialise in trading the AUD, JPY, CAD combinations to add some diversification to the trades I am copying.

Friday 28 October 2011

Zulutrade signal provider - SAKOFX

I added the signal provider SakoFx this week. The signal provider has only been operating for 8 weeks however the trade patterns have held up well through a very  volatile period in the markets and with max open trades of 6 it appears there is more behind the system than blatant commission hunting.

The below image shows the analysis of SakoFx trading history to date. Based on historic trade data the system is profitable from a stop loss of just 30 pips, using a stop loss of 100 pips historically returns 10.4 pips per trade or 139 pips per week. Impressive returns so far and the trading patterns appear  consistent and responsible.

Monday 24 October 2011

Zulutrade results for the week ended 22 October 2011

Profit for the week £10.1 (152 pips)
Loss since beginning £228 (1943 pips)


The below image shows results for the week for each signal provider.

FORABCD continues to perform very well in the current turbulent economic climate, forex cruise control is also performing well. Timo made a number of winning trades, but ended the week with a small loss after 3 EUR/USD trades went against the trade at the end of the week.Forextechno does not seem to be working for me, this signal provider operates on a momentum trade setting orders just above/below key resistance and support lines.

Overall progress is painfully slow

Friday 21 October 2011

Zulutrade signal provider analysis for the week ended 21 October 2011

Click to enlarge Image
The above Zulutrade signal provider analysis is up to and includes trades to 21 October 2011.

Richter is making consistent gains mainly on the USD/JPY pair, profits are being made using a stop loss of anywhere between 40 pips and above. ClimberSB and SuccessOne are also generating good profits in the current volatile market.

Monday 17 October 2011

Zulutrade performance week ended 15 October 2011

Loss for the week £100 (1555 pips)
Cumulative loss since start £238 (2098 pips)


This was another bad week, a very bad week. I got badly burned by holding  EUR/USD sells over the weekend and come Monday I had lost 25% of my accounts value overnight as the EURO strengthened.


The above image breaks down signal provider performance for the week. ClimberSB, ForexCruise control and FORABC made a profit for the week as did Richtor who I have recently added. I have decided to drop 123.CN and CC12345678 due mainly to the number of trdes these signal providers are opening at the same time. I am not happy to see 4 or 5 trades opened within 2 minutes of each other at the same price, this is clearly commission seeking and it goes against best interests of the followers to these signal providers.

Zulutrade signal provider performance analysis 12 October 2011


Click on the image to make it larger.

This is an excel workbook I have set up which shows the performance of a number of signal providers which I am following or watching. The workbook takes the historic trading data and using an if function to calculate the stop loss at increments of 10 pips from 10 (min) to 200 (max). From this I calculate an optimum stop loss (low, medium and high). The far columns show the most recent 20 trades to give an indication of the current performance vs. historic performance of each signal provider. I am updating this spreadsheet weekly and will be adding signal providers to the listing if it appears they are trading profitably.


Ideally I am looking at using a stop loss of no greater than 100 pips. The below image is sorted by average pips per trade using an optimum stop loss of 100 pips or less. It would seem logical to just take say the top 5 signal providers from this list, however when we look at the most recent 20 trades it is clear that some of these signal providers are not performing well in the current volatile trading environment. I am looking to add signal providers who average greater than 10 pips per trade at a stop loss of 100 pips and who have traded profitably over the most recent 20 trades. The below image shows those providers which fit this criteria. The excel query is +10 pips per trade and trading profitably over most recent 20 trades.


Tuesday 11 October 2011

Zulutrade Signal Provider Analysis - ClimberSB

Zulutrade profile page (click to enlarge)


I have analysed the trades of ClimberSB zulutrade signal provider in excel. The following analysis is based on Historic data as at October 12, 2011.

Highlights and Findings:
  • ClimberSB averages 6.4 pips per trade
  • The maximum loss based on trading to date is 90 pip (realised.)
  • The optimum stop loss for this signal provider is 90pips, which generates a profit of 6.4pips per trade.
  • A lower stop loss of 50pips generates a profit of 6.04 pips per trade.
  • The signal provider does not make a lot of trades. Max open trades is 2 and the average weekly pips based upon a stop loss of 90 pips is 59 pips per week.
  • The Signal Provider has performed well recently. Over the past 20 trades ClimberSB has averaged 18.5 pips based on a stoploss of 50 pips or more.
In summary ClimberSB appears a consistant and low risk zulutrade signal provider.

What the #@*$@ just happened

And herein lies the danger of manual trading. The EUR/USD sell trade which I loaded up on Friday has turned bullish and my profitable positions I carried into the weekend are now well in the red. The following graphic shows the problem. I'm now in danger of busting my account. As the Old Beatles song goes..."I should have known better ......."

I am down £60 in the space of 12 hours and this doesn't include the open positions which are down another £100. The only hope is to hold these in the hope the EUR/USD turns around fast and attempt to trade out of them.


What is puzzling is the reason for the turn in the EUR/USD, zerohedge website explains the situation.
http://www.zerohedge.com/news/eur-shorts-flee-overcrowded-burning-theater-disorderly-multiple-file-exodus

I have also decided to drop the signal providers ccc12345678 and 123.CN in the space of 12 hours these signal providers have cost me (combined) over 900 pips by opening up a series of trades all going in the wrong direction.

Sunday 9 October 2011

Zulutrade results - 8 October 2011

Profit for the week £39.1
Loss since starting £138

Well finally I have ended the week with a profit of £39 and my overall loss is now £138. Still well behind but finally I am moving in the right direction.

The week started off well with steady gains been made by a number of signal providers then on Friday things went horribly wrong. The Bank of England surprised the market by announcing more QE than was predicted and a number of SP's jumped on the sell GBP v USD trade, which seemed pretty logical to me. What happened next was quite inexplicable, the GBP after dropping to 1.53 started to rise and it kept rising. I found myself well underwater on a number of positions and when the GBP/USD hit 1.562 I was in danger of my account blowing out completely. So I broke one of my rules and started to trade manually, doubling up on the sell GBP/USD trades once it hit 1.56, fortunately the market came back as expected and I finished the week on a high.

The following screenshot tells shows signal provider gains/losses for the week ended Saturday 8 October 11.


I have decided to drop fx178, a good provider but too risky for me. I don't have the capital to endure some of the losses on open positions.ccc12345678 has a couple of 100+pip open positions at the end week which will turn around his performance. The stand out performers for the week were Climber SB and FORABCD. I am happy with the trading styles of these 2 signal providers.

The following screenshot shows signal provider profits since starting. It is a depressing graphic, I think I need a drink.

Wednesday 5 October 2011

Week 2: October 2


Loss for the week £8.40 (100 pips)
Loss since starting £177.20 (1199 pips)

Another tough week, just as it looked like I was starting to finally make some headway a couple of providers open up some bad trades and I end the week at a loss of 100 pips. I am using some pretty tight stop losses which are getting hit far too often. The below graphic shows provider pips vs follower pips (me).


What is striking is the difference between the providers earnings and mine from following. The divergence is almost solely due to the stops I have put on each provider, as can be seen I have turned a sizable profit from FX78 into a loss just by using a stop loss!! (at 80 pips). It is tempting to relax the stops, however these have been calculated to the optimal risk/reward for each signal provider and I cant risk letting losses ride as I did in week 1.

I decide to continue with the same providers and stop losses at least for another week, and will re-assess if these problems persist.